A Total Solar Eclipse (TSE) provides us with an exciting opportunity to study the VLF propagation effects under a controlled experimental condition where the extreme ultraviolet and the X-rays from the sun are totally blocked by the moon. During the total eclipse of July 22nd, 2009, the Indian Centre for Space Physics conducted a VLF campaign to obtain the signal from a dozen of places in the Indian sub- continent. Six of these locations gave very good and noise-free data. We simulated the VLF observational data and obtained the electron density variation in the lower ionosphere during the eclipse time.
.bmp) |
.png) |
|
Typical Spectrogram from Raiganj site at pre-eclipse, maximum-eclipse and post-eclipse conditions (left). The VTX signal (yellow color in online version) clearly became weaker during the maximum phase of the eclipse. The data from 4 h to 20 h (IST) at (a) Kathmandu (b) Malda, (c) Khukurdaha, (d) Raiganj, (e) Salt Lake and (f) Pune (right). The blue curves represent the normal diurnal behavior (average of the day before and after the eclipse) at different places and the red curves represent the diurnal behavior on solar eclipse day at those places (see Chakrabarti et al., 2012, JASTP). |
|
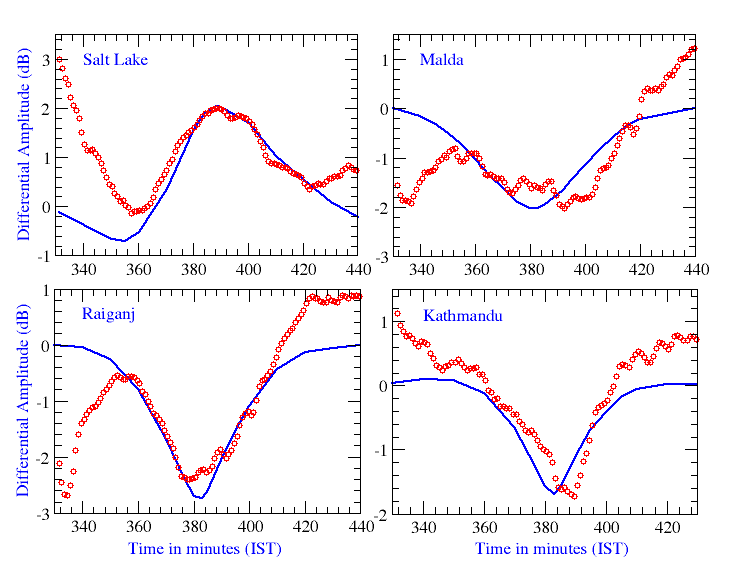 Observed (red) and simulated (blue) results of amplitude perturbations of the VTX (18.2 kHz) signal due to the solar eclipse of 2009 (for details see Pal et al., 2012a). |
A ground based Very Low Frequency (VLF) radio receiver of Indian Centre for Space Physics located at Khukurdaha (22 degree 12 min 70 sec N, 87 degree 14 min 50 sec E) monitored the VLF signal at 19.8 kHz from the NWC station during a partial solar eclipse (maximum obscuration 75%) which took place on January 15, 2010. The receiver and the transmitter were on two opposite sides of the annular eclipse belt. During the same period, a solar flare also occurred and it was partly blocked by the lunar disk. Thus the resultant signal was perturbed both by the eclipse and by the flare.
 |
 |
|
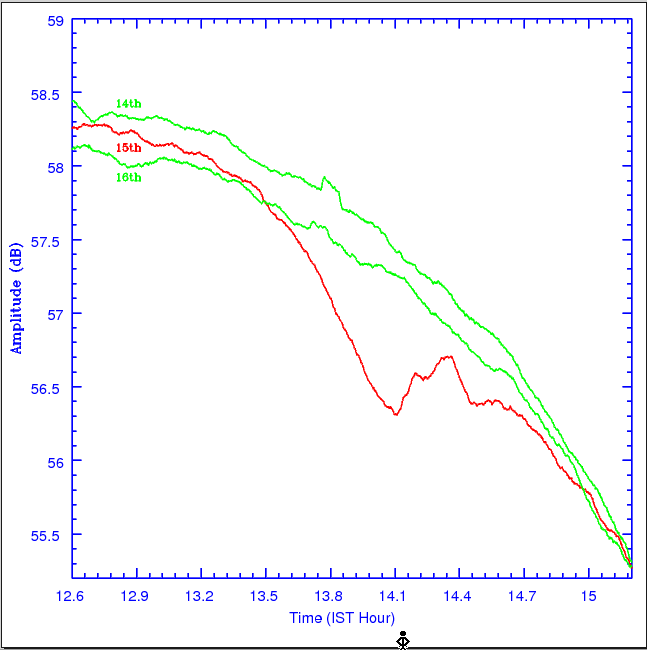
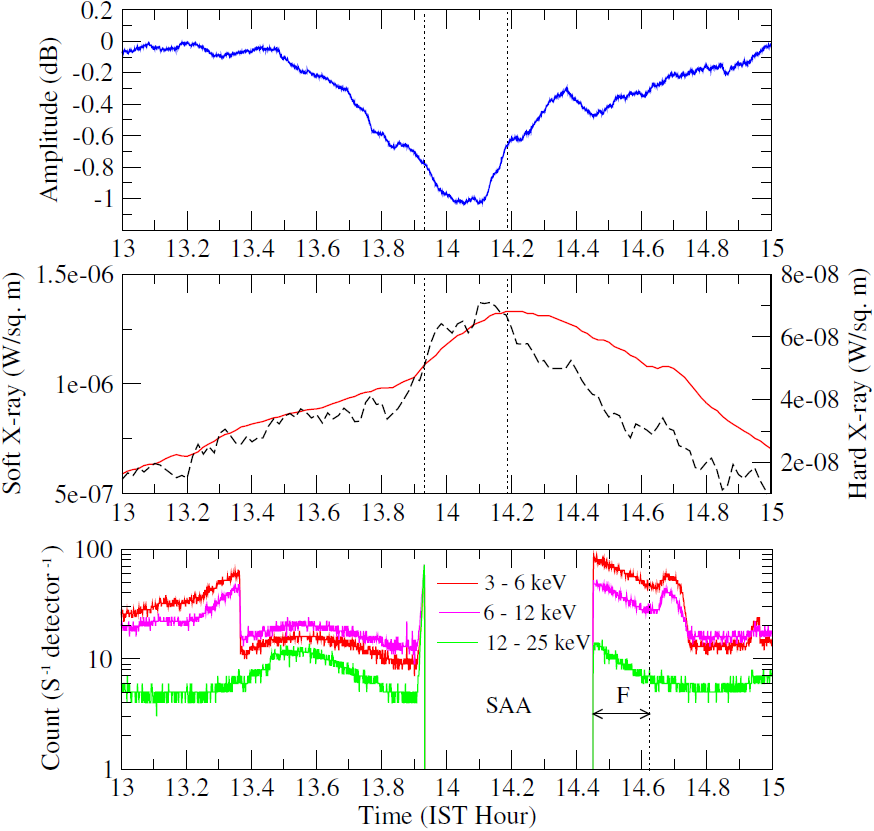
The normalised variation of NWC (19.8 kHz) signal amplitude (left) before, on and after the eclipse day (15th). Observed VLF data with GOES-14 and RHESSI soft and hard X-ray light curve (right). Upper panel shows the VLF amplitude deviation due to the combined effect of the solar eclipse and the solar flare obtained by subtracting the data of January 15th from the average of the normal data of 14th and 16th January, 2010. In the middle panel, the dashed curve shows the hard X-ray flux and solid curve shows the soft X-ray flux of the flare as obtained from the GOES satellite. Lower panel shows the RHESSI data of X-ray flux in different energy band at the same time (see Pal et al., 2012b). |
|
 |
 |
|
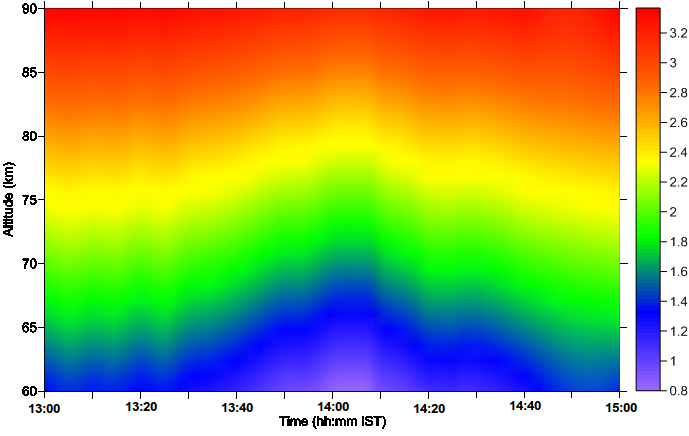
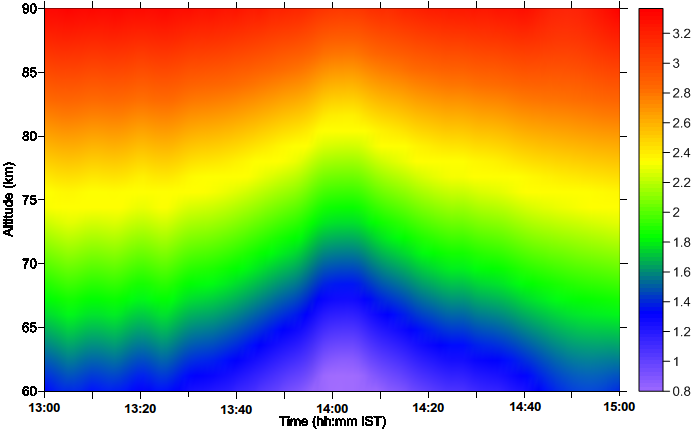
Variation of electron density in logarithmic scale (per cc) with altitude for the combined effects of solar eclipse and solar flare (left) and for the effect of solar eclipse only (right). |
|
 |
 |
|
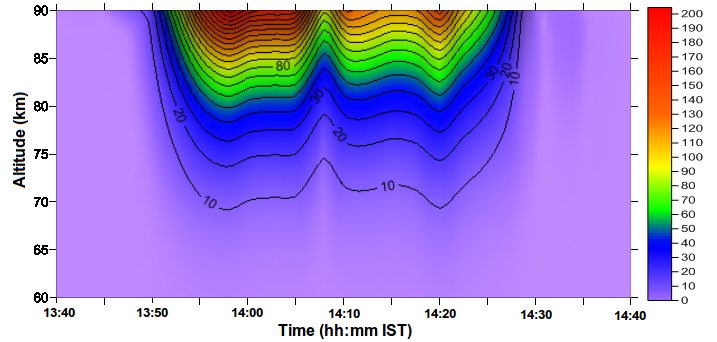
Occultation of the solar flare by lunar disk during solar eclipse of 2010 as seen from Kolkata (left) and the variation of electron number density induced only by the occulted solar flare in linear scale (right). |
|
A ground based Very Low Frequency (VLF) radio receiver of Indian Centre for Space Physics located at Khukurdaha (22 degree 12 min 70 sec N, 87 degree 14 min 50 sec E) monitored the VLF signal at 19.8 kHz from the NWC station during a partial solar eclipse (maximum obscuration 75%) which took place on January 15, 2010. The receiver and the transmitter were on two opposite sides of the annular eclipse belt. During the same period, a solar flare also occurred and it was partly blocked by the lunar disk. Thus the resultant signal was perturbed both by the eclipse and by the flare.