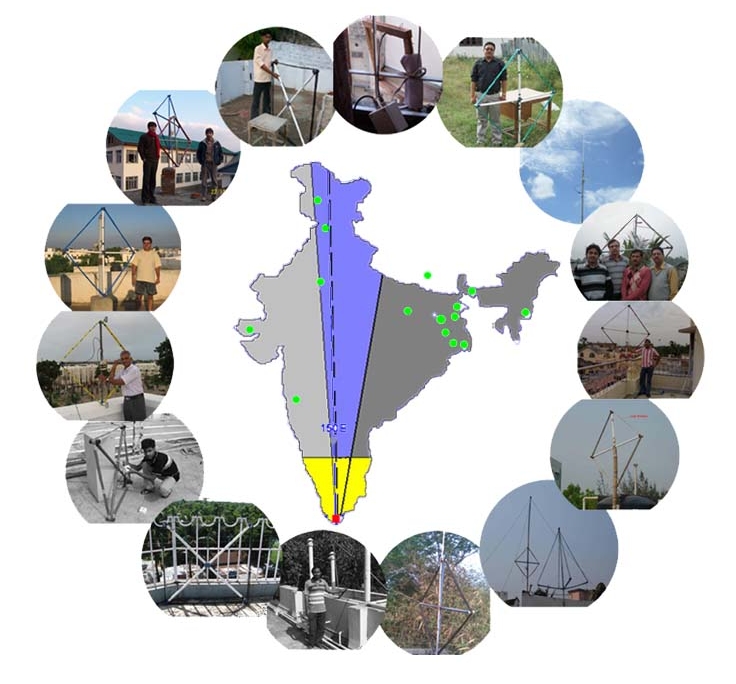
 The map of India showing all the receiving stations (green circles) employed in our campaigns. The Indian sub-continent has been divided into four zones depending on the characteristics of the received signal from the Indian VLF transmitter, named VTX (18.2 kHz), located near Kanyakumari (For details see Chakrabarti et al., 2010, 2012a, 2012b). |
1) The main motivations for the campaigns were to test our understanding about the VLF propagation over land mass and specifically, whether the observational results could be explained by the theoretical models.
2) A large region of the Indian sub-continent is vulnerable to earthquakes. In order to study the seismo-electromagnetic precursors, it is relevant to know if the VLF signals are strong enough at the monitoring stations. Therefore, it is necessary to check/obtain the VLF signal behaviour in seismically quiet days to quantify the anomalous VLF signal behaviour possibly related to Earthquakes.
3) Another reason of the VLF campaigns were to understand the global ionospheric effects of rare celestial events such as the Solar Eclipse, Gamma Ray Bursts etc. A global ionospheric weather map can be made based on these studies from a large number of VLF weather stations.
|
|
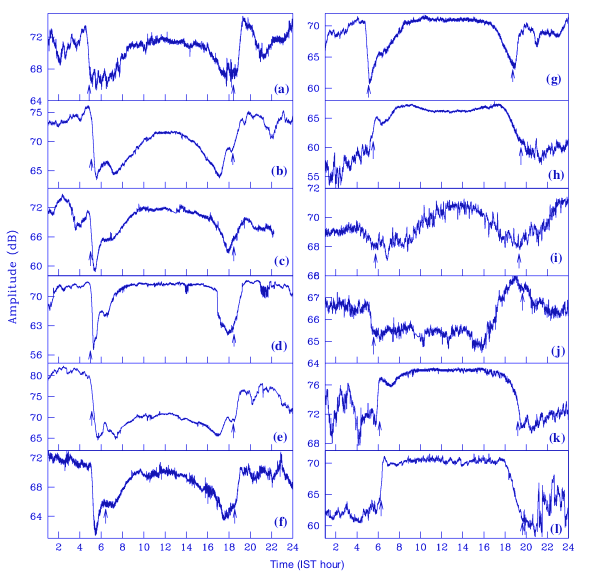
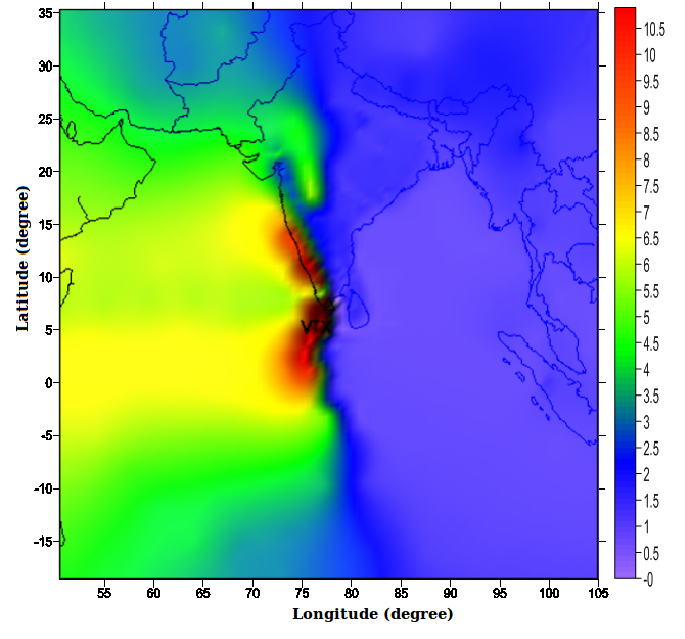
Normalized observed data (left) over the whole day in Indian Standard time (IST) from some of the receiving stations in summer: (a) Coochbehar (b) Salt Lake (c) Malda (d) Raiganj (e) Khukurdaha (f) Bhagalpur (g) Kathmandu (h) Kangra (i) Jaipur (j) Kashmir (k) Pune and (l) Bhuj. The computed variation of night time attenuation coefficients (dB/Mm) of mode one of the VTX (18.2 kHz) signal (right) as a function of latitude and longitude. The location of VTX transmitter is indicated in the figure. For detail explanations see Chakrabarti et al., 2012b.
In future, we will increase the number of permanent stations for such studies. Our campaigns may be thought of as 'dry-runs' for such permanent stations which could be required for disaster managements and for detection of high energy phenomena in space.
|
|
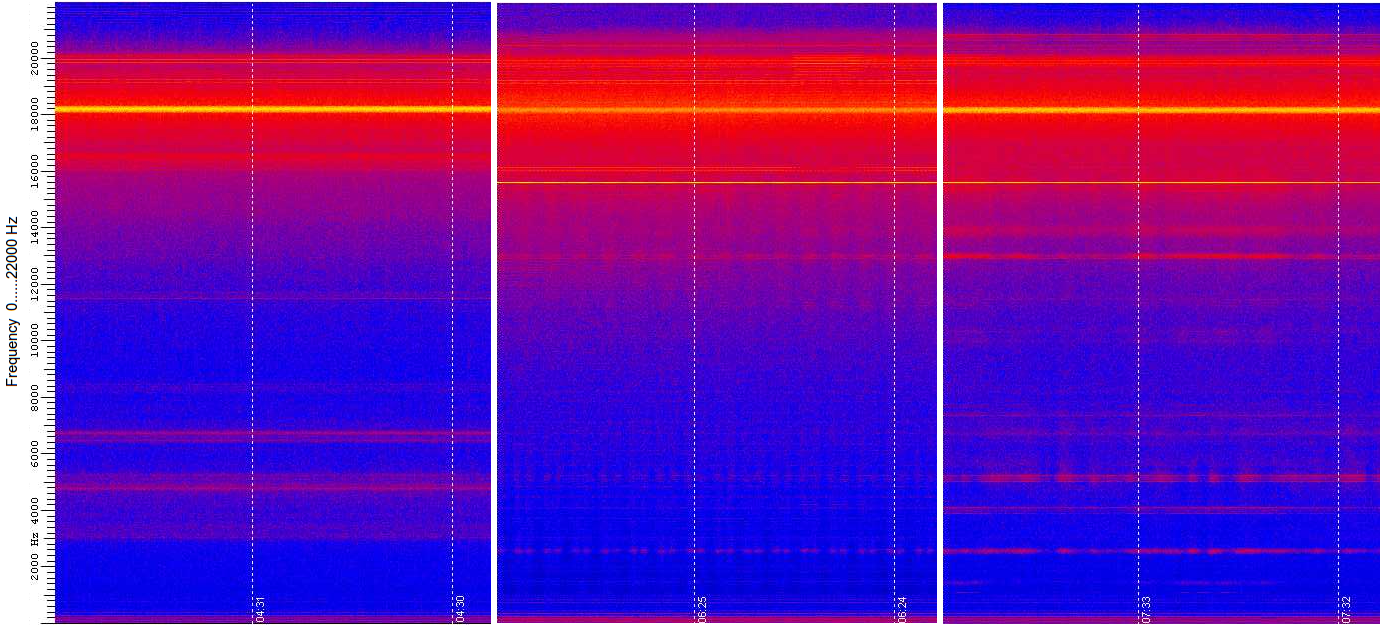
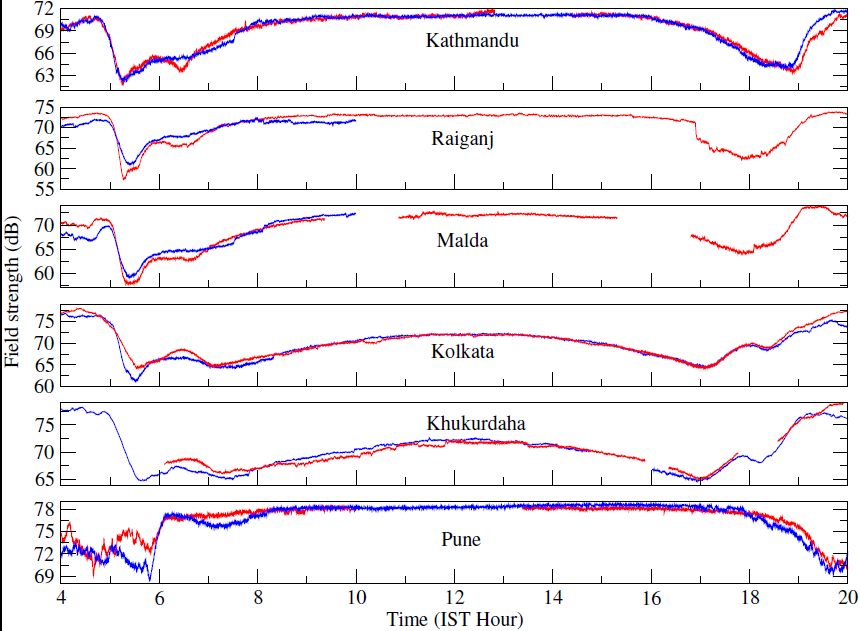
Typical Spectrogram from Raiganj site at pre-eclipse, maximum-eclipse and post-eclipse conditions (left). The VTX signal (yellow color in online version) clearly became weaker during the maximum phase of the eclipse. The data from 4 h to 20 h (IST) at (a) Kathmandu (b) Malda, (c) Khukurdaha, (d) Raiganj, (e) Salt Lake and (f) Pune (right). The blue curves represent the normal diurnal behavior (average of the day before and after the eclipse) at different places and the red curves represent the diurnal behavior on solar eclipse day at those places (see Chakrabarti et al., 2012, JASTP).